Design Review 1: February 22th
Agenda:
- Attendance
- Meeting Leader: Mike
- Minutes: David
- Power Scheme
- Tapping into Keurig 12V Power
- Regulator Selection for step-down from 12V to 3.3V (or 5 V if needed)
- ESP32-S3 Selection
- Sufficient IO
- 41 Usable (non-strapping) GPIO pins
- Detailed Subsystem Designs
- Sensor Subsystems
- Cup Height Detection
- Liquid Filling Detection
- User Interface Plans
- Considered options at this point
- Coffee Brewing Process
- User Interaction Simulation to control Keurig
- Signals to simulate/control
- Limit Switch (0-3V)
- Power Button (0-3V)
- Brew Button (0-3V)
- Pump (0-12V)
- Reservoir Sensor (0-3V)
- Heater Sensor (0-3V)
- Design Review 2 Plans
- Progress Already Made
- Next Steps
- Integration across a single system to start to compile for final design
2) Power Scheme
The power scheme for our project is quite simple. According to the testing done on our Keurig mini that we’ve been using, most of the components run on 12 Volts DC. We play on tapping into an easy-to-access connector to get 12 V from the Keurig Board to power up our board. With that, that will give us enough voltage to power and control some of the mechanical components of the Keurig, and give us plenty of power for the other major components on our board. Most of our components on our board will run on 3.3 Volts. The below regulator was selected to convert 12 V to 3.3 V DC.
Current Output: 2A
Unit Price: $2.81
We believe this will supply the output current needed to supply the ESP32, and the other smaller sensor components on our own board that we’ll be making ourselves. This will also power our FET transistors which will serve as switches to certain portions of the coffee maker, to be elaborated on in the subsystems section.
We also believe gaining access to a 3 V rail on the Keurig board to power the Keurig sensors from our board should be a menial task.
3) ESP32-S3 Selection
Reasoning: To handle the more demanding I/O requirements of this project, the team landed on the ESP32-S3. Compared to its C3 counterpart, the S3 boasts significantly higher I/O, commanding 41 usable I/Os. Many inputs will be necessary from user input, cup height detection, liquid detection, UI interface, etc. Not to mention, the price difference between the C3 and S3 is marginal, which makes the S3 an even more logical choice. While the final design of the coffee maker may not fully use all of these I/O pins, choosing this processor gives us peace of mind that we won’t be cutting it close in terms of I/O and allow us to unlock the full potential of this project.
4a) Major Sensor Components
Cup Height Detection Subsystem
Description of Subsystem Purpose: The cup sensing subsystem is required to 1) determine when a cup has been placed under the nozzle and 2) measure the height of the cup. The system is required to accommodate cylindrical cups as large as 10 inches in height and 4 inches in diameter. The system must also accommodate cups of various colors, materials, and textures including translucent cups. The subsystem should also be robust against external factors such as ambient light and sound. This system must not present safety hazards to the user including but not limited to the possibility of laser exposure. Additionally, the system should provide the user with immediate feedback regarding the detection of a cup and its corresponding height. This data must also be provided as inputs to the main board to be used in accurate pouring of the liquid.
Requirements:
- Detect variety of cup material types
- Evaluate proximity of cup to different Time-of-Flight (TOF) sensors to determine height
- No interference between different TOF sensors when measuring
PCB Requirements:
- This PCB will be the most complex, time intensive part of this project. It will contain our ESP32, cup height sensors, multiplexor, auxiliary board connections, as well as power conditioning for all onboard components as well as breakout boards.
- ESP32-S3 (extra I/O compared to C3 counterpart)
- 8-10x (TOF sensors)
- 8-10 Channel Multiplexer
- Buck Converter: Step down from input voltage to 2.8V output
- I2C/SPI connector #1 (communication with liquid sensing breakout board(s))
- I2C/SPI connector #2 (communication with display used in UI)
- Additional Header Pin Connections
- Water Boiler Temperature Input
- User selected (%) filling of cup (potentiometer voltage input)
- Debug connections for I2C/SPI readings
Sensor Specs:
- Sensor: VL6180X Time-of-Flight Proximity Module
- Voltage Input: 2.7 - 2.9V
- Sensing Range: ~0 - 62cm (0 - 24 inches)
- Communication Protocol: I2C
Multiplexor Requirements
- Min. Number of Channels = Number of TOF Sensors
- Supports I2C Protocol
Chosen Component Explanation: For the detection of the cup’s height, the group settled on the VL6180X sensor. Based on our own previous testing, this sensor is fast, accurate, and works with a variety of common cup materials. These Time-of-Flight sensors manage all of these solid qualities while maintaining a relatively low price; this is crucial, as we need 8-10x of these sensors to accurately measure cup height across a wide range of possible cup heights. The group settled upon this number based on the idea that, assuming a minimum cup height of 5cm, 10 sensors equally spaced between 5-30cm would give accuracy down to 2.5cm, or 1 inch fidelity. To account for this large quantity of sensors all with the same address, a multiplexor is necessary to properly send I2C signals between the microprocessor and each sensor individually.
Liquid Filling Detection Subsystem
Description of Subsystem Function: The coffee pour tracking subsystem must periodically measure the height of the liquid inside the cup. This measurement system must accommodate distances between one and ten inches. The system must also be capable of measuring distances to both solids (the bottom of the cup) and liquids and must accommodate a variety of colors and transparencies. The tracking subsystem should be unimpeded by the cup walls, the stream of coffee being poured, the inherent steam produced from brewing hot drinks. The subsystem should also be robust against external factors such as ambient light and sound.
Requirements:
- Detect accumulation of liquid pouring into cup
- Sense liquids with different levels of transparencies (i.e. water, coffee)
- Differentiate between accumulated liquid, pouring liquid, & cup walls
Board Requirements:
- No integrated power regulator required (conditioned power supplied by main PCB)
- Small form factor (ideally < 1 inch2) to prevent interference with pouring nozzle
Sensor Requirements:
- Sensing technology: Ultrasonic/Time-of-Flight(IR)/Capacitive/Radar Sensor
- Input Voltage: 3.3V or 5V
Chosen Components: For this subsystem, significantly less time will be spent on the building process. However, significant time investments still need to be made to determine which of the possible sensors best fits the role of liquid detection. So far, the group has done testing on two variations, Time-of-Flight and Ultrasonic. The VL6180X sensor chosen for cup height detection performed adequately in coffee detection testing, but failed to give any reliable measurement for the coffee. Meanwhile, testing of the HC-SR04 Ultrasonic sensor showed better detection of water compared to Time-of-Flight, yet was still too unreliable in both water and coffee detection to solidify it as our chosen sensor choice. While these test results do not completely rule out these sensor types, it has become increasingly evident that liquid detection is substantially more difficult that the cup height detection. Two other sensor categories the group looks to explore are capacitive and radar sensors. These offer the possibility of a narrower beam angle to help in the misdetection of the liquid coming from the dispenser nozzle and detection of cup walls, both of which would make it difficult to determine when to stop the coffee pouring. In terms of board specifics, the board will be a pre-designed breakout board; the group has determined that the construction of a custom PCB for a single sensor would be expensive and time intensive with minimal benefits versus an existing breakout board.
4b) UI
Requirements:
- Display % filled
- Show when pouring
- Display when brew is finished
- Prompt user to change pod when necessary
TFT LCD 1.28” (Link)
Rotary Encoder (Link)
Black Metal Potentiometer Knob (Link)
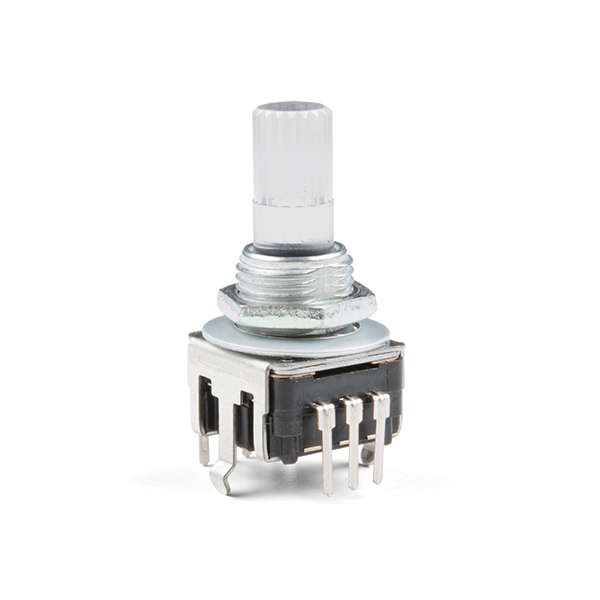
The TFT LCD screen will Display to the user what percentage the coffee-maker is currently set to. Percentage indicates the percentage of the height of the cup that should be filled (most perfect cups of coffee that fill the cup to its full potential without going to the top will be set to around 70-80%). The Rotary encoder not only serves as a potentiometer dial to change the fill percentage, but it has a push button that enables the user to start the brew right from the dial, rather than having to add an additional button. The encoder also has inside it a RGB encoder to give a color indication to the user of how far they turned the dial in addition to what appears on the screen.
4c) Coffee Making Process
Via hands-on testing with the coffee maker, we were able to determine the following essential components are in control of the coffee brewing process, and give us a lot of insight of what we can tap into to establish our own control over the coffee-making process.
- The Limit Switch signal ranges between 0-3 V, and is at 0 V when the K-Cup insertion handle is closed after being opened.
- The Power Button signal ranges between 0-3 V, and indicates a reset in the process when it gets to 0 V.
- The Brew Button signal ranges between 0-3 V, and shorts to 0 V when pressed to tell the coffee maker to start the brew
- The pump that pumps water from the reservoir, to the heater, to the output toward the cup operates at 12 V and around 0.8 A at full strength.
- The Reservoir Sensor operates between 0 and 3 Volts, and goes to 0 V when the reservoir has been fully emptied.
- The Heater Sensor operates between 0 and 3 Volts, and goes to 0 V when the Heater is full.
The following gives the brew sequence in technical terms, so that it gives a better understanding of what we can control.
- Plug in Keurig
- Open and close handle (resets limit switch): This would be a point in which a K-Cup is inserted into the holder
- Indicator Light will Flash meaning ready to brew
- Reservoir and Heater Sensors will turn on (~3V across each)
- Brew Button is pushed to begin brew process
- Initiates Keurig Brew Process
- Pump desired amount of water into heater
- 12 V is applied to the pump from the Keurig board
- Simulate sufficiently full heater (Order of steps 5 and 6 is critical)
- Short heater sensor to achieve 0 V
- Simulate empty reservoir (Order of steps 5 and 6 is critical)
- Short reservoir sensor to achieve 0 V
- Heater will turn on after this step
- Indicator light will blink at the start of heating and then turn off
- Wait for water to finish heating
- Indicator light will illuminate solid when heating is complete
- Pump desired amount of water out of heater and nozzle
- If the entire heater is emptied, the indicator light will turn off
- If the entire heater is not emptied in step 8, simulate the pressing of the power button to reset the Keurig to standby.
By shorting certain sensors in the correct order, we believe we can control the steps of the brew from our own board by tapping into different parts of the Keurig, while a challenging and hack-ish task, it’s very feasible. We also think it should not be a challenge to initiate multiple brew cycles if the selected cup is bigger than the maximum amount of water that can fit in the heater.
What’s to be figured out with this subsystem is interfacing our board with these individual mechanical components, in addition to the logistics of the liquid handling. We want to use a larger reservoir than what’s currently being used on the Keurig mini, but we also want to ensure we’re not overflowing the Heater. There needs to be figured out a way to store more water for larger cups, while also maintaining the integrity of the brew process of the heater. In addition, we need to determine when the final brew cycle gets the cup to its top, where will the spare heated water go? These are all mechanical questions that need to be answered as we start to nail down the logistics of our interface.
Communication Protocols:
Communication Requirements:
- Higher speeds required to stop brewing and detect fluid height
- Lower speeds are suitable for cup height, display, and button IO
- Lower power consumption preferred
- Simpler implementation preferred
Based on these requirements, we narrowed down the options to either SPI, I2C, or UART. Each comes with their own unique benefits and drawbacks, and we intend to discuss which would be best to implement in the DR1 meeting.
SPI:
Pros:
- High-speed data transfer (compared to I2C and UART)
- Full-duplex communication.
- Can support multiple devices on the same bus (using separate chip select lines).
Cons:
- Requires more pins than I2C and UART.
- Typically, higher power consumption compared to I2C and UART.
- More complex hardware implementation.
I2C:
Pros:
- Uses only two wires (SDA for data, SCL for clock), reducing the number of required pins.
- Supports multiple devices on the same bus (each device has a unique address).
- Typically, lower power consumption compared to SPI.
- Simpler hardware implementation compared to SPI.
Cons:
- Slower data transfer rates compared to SPI.
- Limited to short-distance communication
UART:
Pros:
- Simple and easy to implement.
- Requires only two wires (TX for transmitting, RX for receiving).
- Suitable for longer-distance communication compared to I2C.
Cons:
- Slower data transfer rates compared to SPI.
- Full-duplex communication requires two pairs of wires.
- Limited in terms of the number of devices that can be connected directly without additional hardware
5) Hardware Demonstration Progress
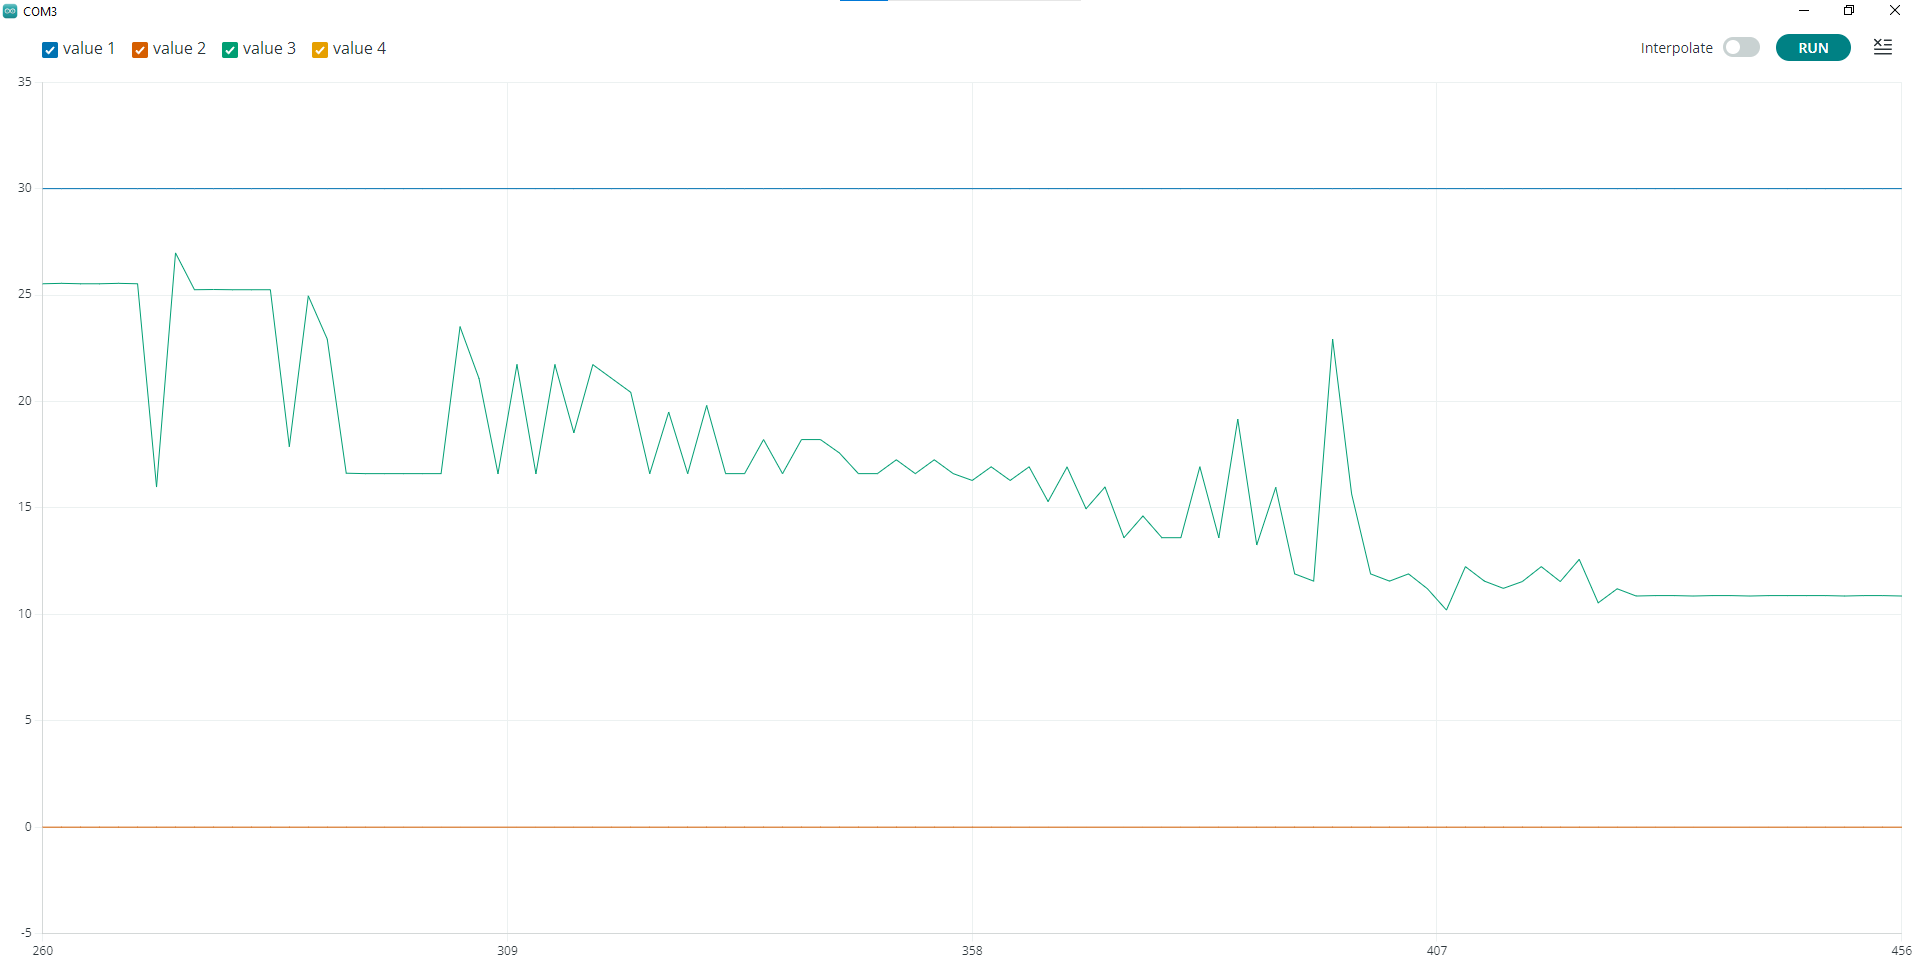
Figure 1: Water Pour Test - Serial Plotter
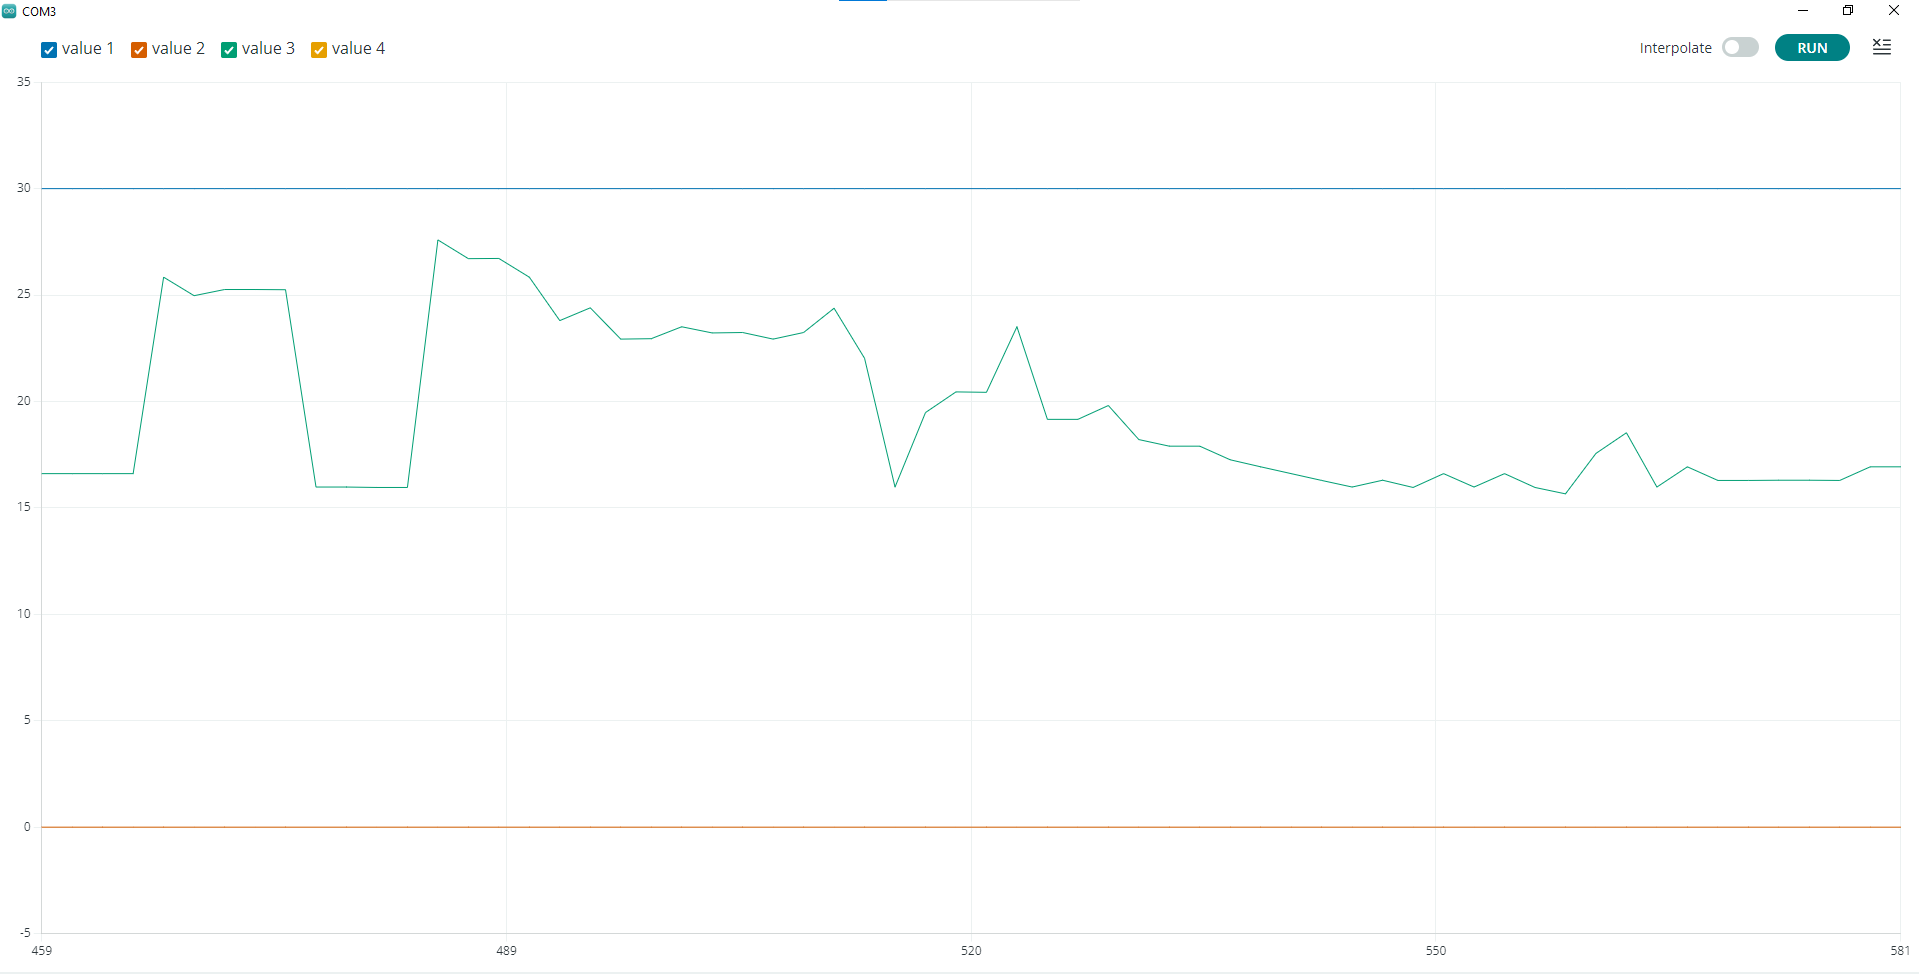
Figure 2: Coffee Pour Test - Serial Plotter
Hardware Demonstration Analysis: Above we see distance measurement versus time using the serial plotter. Data points were collected from the ultrasonic sensor every 100ms and graphed in centimeters. The blue and yellow lines can be ignored as they are used to keep the graph constant in the y-axis. The data above demonstrates the Ultrasonic sensor measuring the liquid that is accumulating as liquid is poured into the coffee. As evident by the results above, the sensor performed adequately for water but very poorly in the coffee results. These tests were repeated five times and showed no improvement. Further tests were conducted with a Time-of-Flight sensor placed adjacent to the Ultrasonic sensor (figures are not shown). Results showed that the TOF was better at coffee but had highly sporadic behavior for the water. These results for these two sensor types point to needing either a combination of sensor technology or an exploration of an entirely new sensor type. These sensor types were initially chosen because of their cheap price and wide availability. However, a more expensive sensor may be needed to meet the design specifications the machine requires.